Choosing between Vietnam and China for 2025 sourcing is no longer a simple comparison of labor rates or factory quotes. Costs now sit across a wide set of variables: workforce dynamics, logistics maturity, supply-chain depth, duties, MOQs, and quality control systems that differ by industry. The gaps between the two countries are narrowing in some areas and widening in others, and each offers unique leverage depending on your product category and growth stage.

This guide outlines the core cost drivers and operational factors that shape sourcing decisions between Vietnam and China in 2025. It presents where each market holds an advantage and where a combined “China+1” model strengthens supply-chain resilience. The focus is supported by factual comparisons to support assessing both markets based on data rather than assumptions.
Contents
Labor Cost & Workforce Dynamics
Labor cost arbitrage is still the main reason companies shift supply chains. But looking only at wages gives an incomplete picture. The real number is the total cost of ownership, which includes productivity and the size of the available workforce. The goal is not the cheapest hourly rate but the output you get from each hour of labor.
Wage Disparity (2025 Projections)
For labor-intensive industries, the cost gap between the two countries is substantial. This gap remains a key driver of the “China+1” strategy (a model in which companies keep production in China but add a second location – often in Southeast Asia like Vietnam, India, or Thailand – to reduce cost pressure, diversify risk, and build supply-chain resilience).
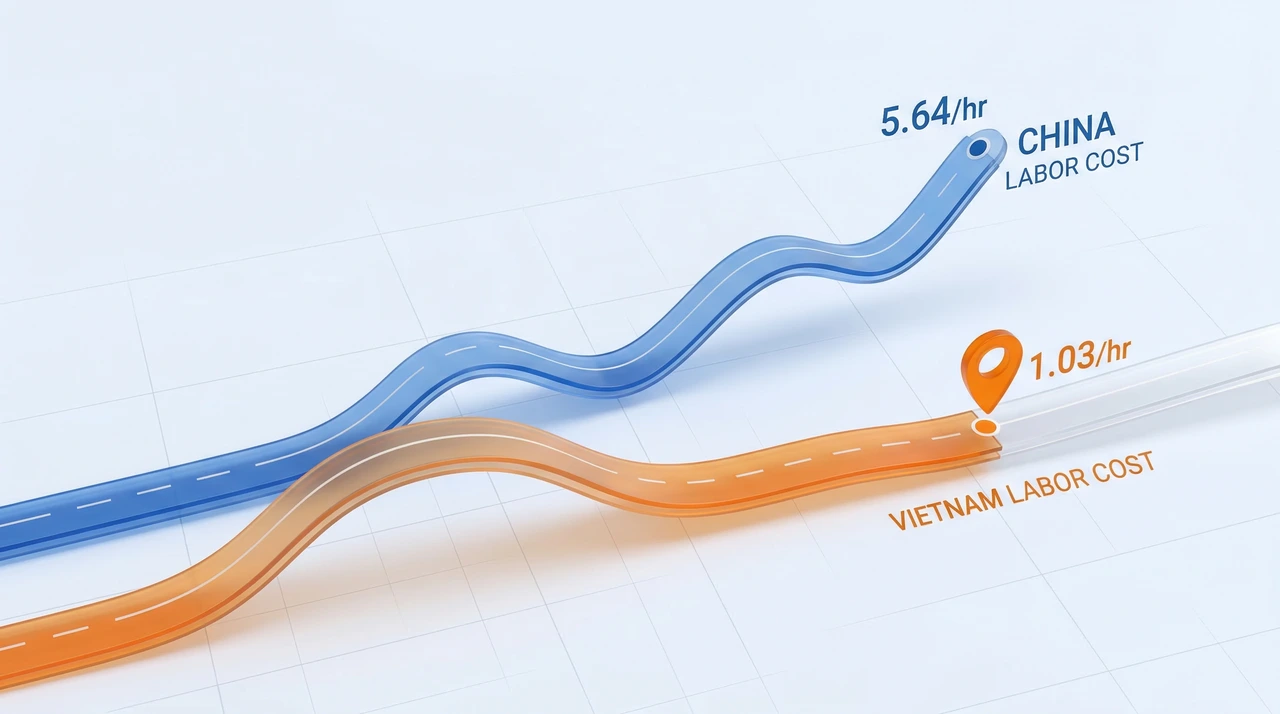
Vietnam’s Competitive Edge: Vietnam’s competitive edge lies in labor cost. According to recent data from Talentnet, Vietnamese factory workers earn roughly 7.7 – 8.4 VND million/month (about USD 304 – 340 per month), translating to approximately USD 1.03 per hour. This wage range makes Vietnam significantly more affordable than many alternatives. It creates a clear margin benefit for high-volume, low-complexity production runs.
China’s Rising Baseline: In contrast, labor costs in China have surged significantly. According to the National Bureau of Statistics of China, the average manufacturing wage reached 78,561 yuan annually, equivalent to roughly USD 903 per month. In the established coastal manufacturing hubs, these wages can be 2-3 times higher than those in Vietnam, eroding margins for commodities where labor is a high percentage of COGS (Cost of Goods Sold).
Skilled Labor Gap
When moving into higher-value manufacturing, the cost structure changes, but the gap remains. The difference in pay for skilled roles reflects the premium placed on technical capability in more mature markets. Skilled workers in Vietnam earn about USD 400 – 700 per month, while similar roles in China range from USD 800 – 1,200 per month (according to Trading Economics). Vietnam still provides a cost advantage, but the talent pool is smaller, which may require additional investment in training or expatriate oversight.
 Productivity & Demographics
Low wages can be misleading when not matched with productivity. The strategic question is whether the cost of labor aligns with the output it generates.
The Productivity Delta: Productivity is a core factor that can strengthen or erode any labor-cost advantage. China maintains a clear productivity lead. According to China Briefing, labor productivity rose 5.84% year-on-year in December 2024, supported by a workforce known for high output intensity and enabled by continuous industrial and technological upgrading. Average monthly earnings of about USD 1,438 reflect China’s ability to sustain higher wages through stronger output per hour.

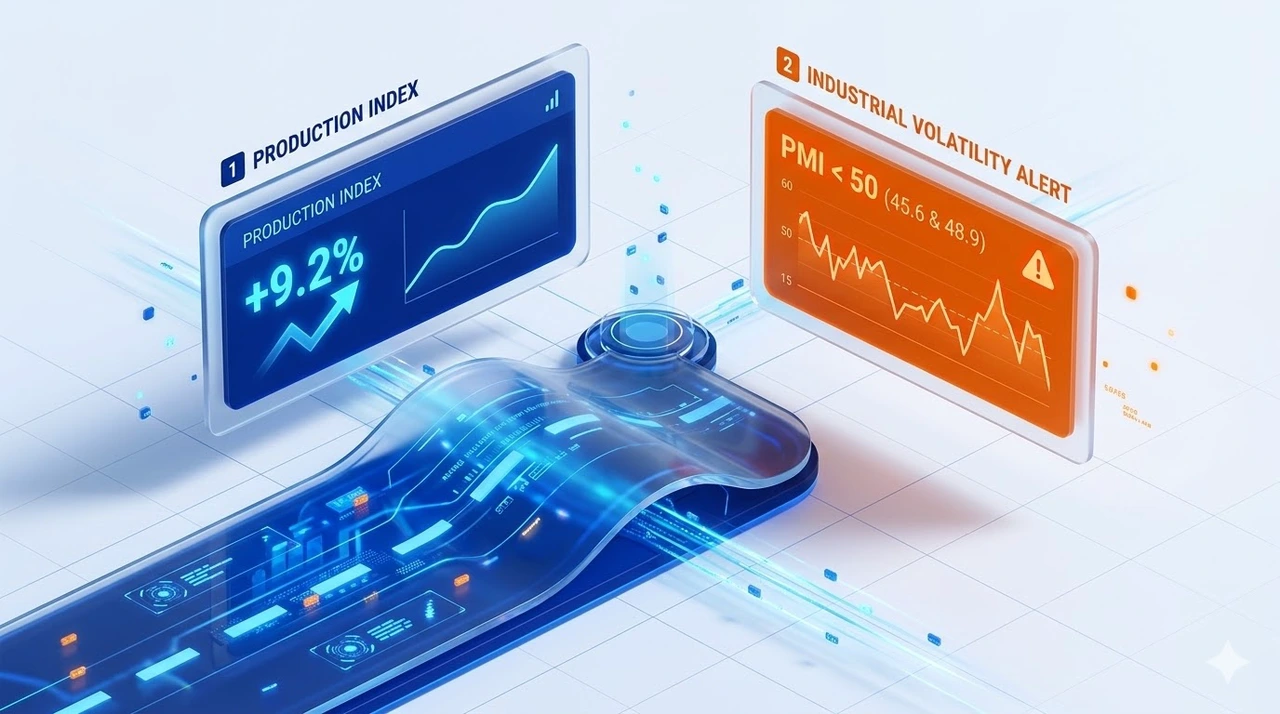
Vietnam’s productivity remains lower. Manufacturing output expanded, shown by a 10.5% rise in the Industrial Production Index, but much of this growth reflects volume rather than per-hour efficiency (according to Vietnam Briefing). PMI (Purchasing Managers’ Index) readings often hover around 50 and dipped below this level in April (45.6) and June (48.9) 2025, signaling operational inefficiencies. As a result, achieving the same output often requires more labor hours or resources, narrowing Vietnam’s cost advantage despite lower wages.
Demographic Dividend: Vietnam holds a clear demographic advantage. According to VnEconomy, the workforce is young, with roughly 74% of workers under age 50 and an average age of 32.5. The labor force reaches about 53 million people in 2025, and 500,000 – 553,000 new workers join annually, supporting long-term labor availability.

China faces the opposite trend. According to China Briefing, the working-age population is shrinking, falling to 857.98 million in 2023 – down 6.83 million from 2022 and 77.02 million from 2013. The share of working-age people declined from 61.3% in 2023 to 60.9% in 2024, while the population over 60 has reached 310.3 million. Projections show the labor pool for industrial jobs could drop 18% by 2035, creating structural cost pressure as supply tightens.
Infrastructure & Logistics
Supply chain predictability often outweighs production speed. A single logistics disruption can offset weeks of output. The infrastructure gap between the two countries reflects a choice between established reliability and an emerging but less mature system.
Infrastructure Maturity
China maintains a clear lead in infrastructure. The 2023 World Bank LPI (Logistics Performance Index) ranks China among the top countries globally for logistics quality, supported by a stable power grid, extensive highways, and high-capacity deepwater ports. Its USD 1.7 trillion logistics market continues to expand, driven by sustained investment and digital adoption, enabling predictable shipping schedules and minimizing peak-season bottlenecks.

Vietnam’s infrastructure is improving but less mature. Key ports such as Hai Phong and Ho Chi Minh City are expanding but still face congestion and outdated facilities compared to China’s automated hubs. Vietnam’s LPI score has risen but remains below China’s, leading to higher risk of delays during demand surges and requiring businesses to carry greater safety stock, often 20 – 30% more.
Shipping Costs & Transit Times
Shipping costs and transit times to Western markets are now comparable between China and Vietnam. The Liner Shipping Connectivity Index (LSCI) from UNCTAD (United Nations Conference on Trade and Development) shows why: China ranks #1 globally, while Vietnam has risen into the top 25 with an index score of 70 – 80 versus China’s 160+, allowing Vietnam to access mainline routes and avoid costly feeder legs. This drives freight rates that closely track China’s.
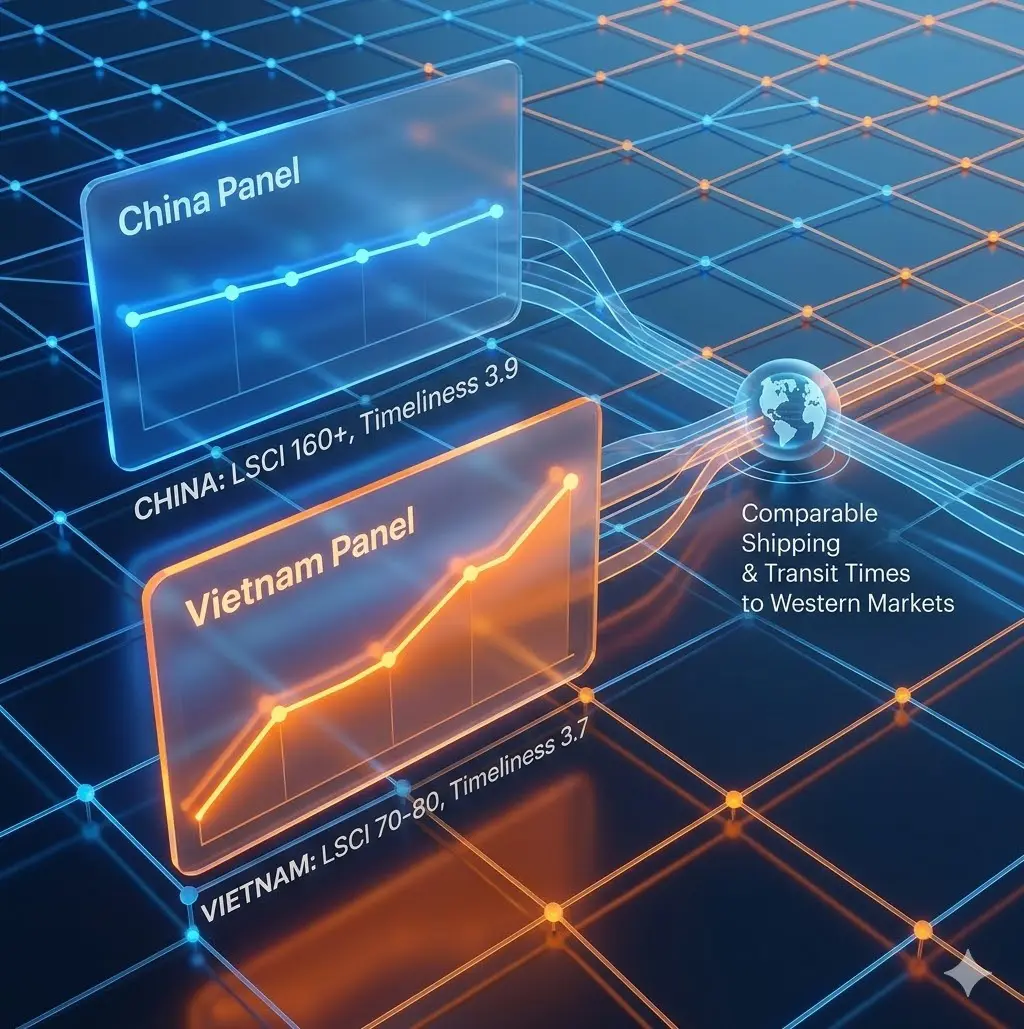
Transit-time reliability shows a similar convergence. According to the World Bank’s 2023 Logistics Performance Index, Vietnam ranks 30th globally in Timeliness with a score of 3.7, just behind China’s 3.9 (ranked 19th). The narrow gap confirms that Vietnam’s long-haul shipping performance now meets international standards. It delivers on-time sailings and stable schedules, making it comparable to China for Western supply chains.
Raw Materials & Supply Chain Depth
The depth of the local supply chain dictates the speed of the “Concept-to-Consumer” cycle. This is where the structural difference between the two nations is most profound.
Vertical Integration vs. Import Reliance
China remains a fully integrated manufacturing ecosystem: According to China Briefing, government and industry data show that China sources over 90% of its materials domestically, supported by dense industrial clusters where components – zippers, fabrics, electronics, packaging, and machinery – are produced within the same park or province. This vertical integration, reinforced by targets under the “Made in China 2025” plan to reach 70 – 90% domestic sourcing, enables rapid design changes and shorter development cycles.

Vietnam, by contrast, relies heavily on imported inputs: Customs data indicates that Vietnam imports roughly 70% of its raw materials, with China as its dominant supplier. According to the General Department of Customs, in the first two months of 2025, imports from China reached USD 23.3 billion, up 20.7% year-on-year. Total imports from China in 2024 – 2025 were approximately USD 144 billion, accounting for 22% of Vietnam’s total import value. Key categories include electrical machinery and equipment (USD 58.6 billion), machinery and reactors (USD 18.5 billion), iron and steel (USD 7.3 billion), and knitted fabrics (USD 5 billion). This dependence positions Vietnam as an assembly hub rather than a fully integrated production base.
Strategic Supply Chain Risks
Vietnam’s reliance on Chinese inputs creates a structural supply-chain risk. According to the General Statistics Office (GSO), in the first seven months of 2025, China supplied USD 101.45 billion of Vietnam’s imports, accounting for 40.2% of total import value, up from 37.31% the year before. Key categories included computers, electronics, and components at USD 28.55 billion (+47.1%) and machinery and equipment at USD 21.32 billion (+35.5%), representing 64% of national imports in these sectors. This dependence means that any disruption affecting China, tariffs, shortages, or geopolitical shocks can stall Vietnam-based production due to a lack of upstream inputs.

Transport between the two countries is fast, often 1 – 3 days by land or short-sea routes, but cross-border movement adds customs procedures and inspection delays that do not exist within China’s domestic supply chain. According to China Global South Project, Vietnam’s USD 66.5 billion trade deficit with China in early 2025 further illustrates the hidden cost of this reliance, where even minor upstream disruptions can interrupt downstream manufacturing despite short transit times.
Manufacturing Capabilities & Quality Control
Selecting a manufacturing destination is not merely about cost; it is about capability alignment. The technical requirements of the product must match the industrial maturity of the region.
Industry Specialization
China specializes in high-tech, high-precision, and complex manufacturing. Data from the International Federation of Robotics (IFR) shows China operating more than 2 million industrial robots, accounting for 54% of global demand. In the first nine months of 2025, it produced about 595,000 industrial robots, nearly 30% higher year-on-year. This level of automation-concentrated in automotive, electronics, and new-energy sectors supports large-scale production, lower per-unit costs, and rapid flexibility despite higher labor rates.
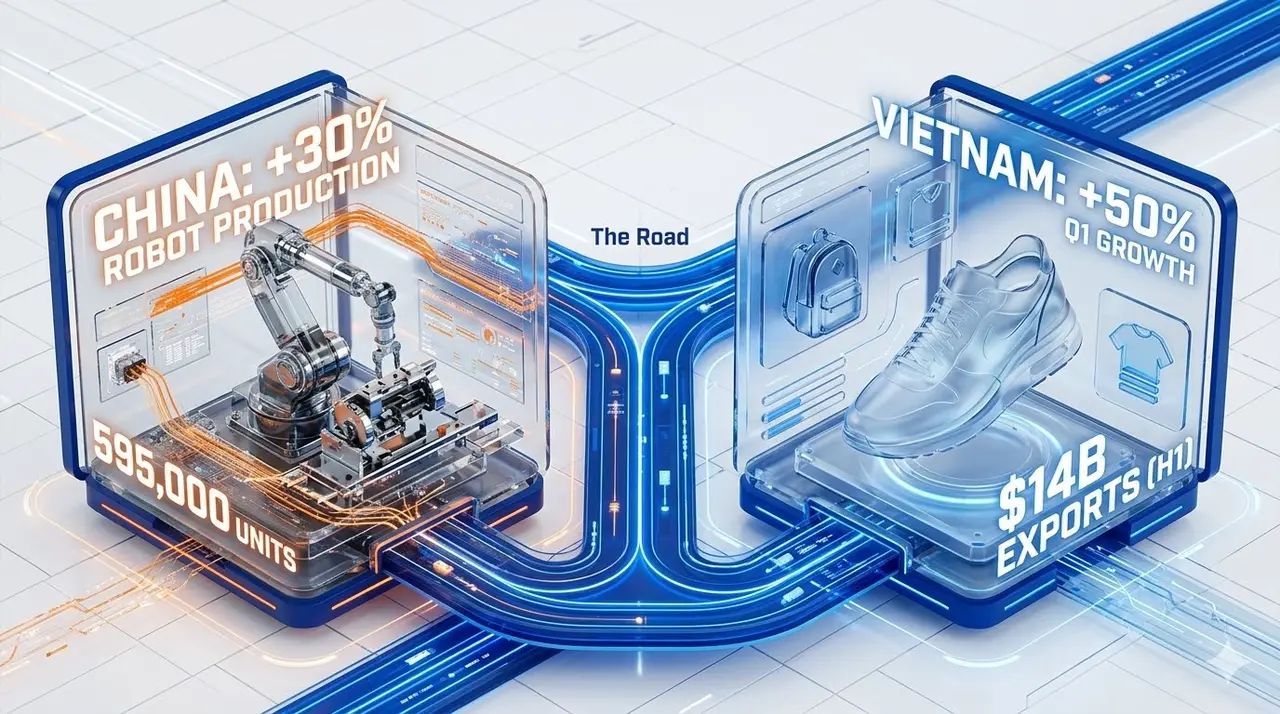
Vietnam’s strength in mid-tier, labor-intensive manufacturing is reflected in its footwear, apparel, and backpack sectors. According to Vietnam Industry and Trade Information Center (VITIC), in 2024, footwear exports reached approximately USD 27 billion, making Vietnam the world’s largest footwear exporter. Major brands such as Nike, Adidas, and Samsung rely on Vietnam’s cut-and-sew and mid-tech assembly capabilities. In early 2025, the sector continued to expand, with footwear exports rising nearly 50% year-over-year in Q1. For the first half of 2025, leather and footwear exports exceeded USD 14 billion, including USD 12 billion from footwear alone, up 10.1% from the same period last year.
Quality Standards & MOQs
Quality Management: China applies mature and standardized quality management systems. ISO- and AQL-based practices are widely implemented, supported by government oversight. In the second 2025 CCC validity inspection, the State Administration for Market Regulation reviewed 3,001 batches across 23 product categories, covering 73.5% of certification bodies and revoking 1,557 certificates for non-compliance. China has aligned over 80% of standards in key industries with international norms and contributed 182 global standards, reflecting a high level of standardization. AQL methods such as AQL 2.5, enforced through CNAS-accredited bodies, are standard practice across major manufacturing sectors.

Vietnam’s quality performance is improving but remains inconsistent. Reports from the Ministry of Industry and Trade and the General Statistics Office highlight volatility in performance indicators: the Industrial Production Index rose 9.2% in the first 10 months of 2025, yet PMI readings fluctuated below the 50 benchmark – 45.6 in April and 48.9 in June – indicating variable output stability. Vietnam’s Industry 4.0 strategy targets annual labor productivity growth of 7.5% and alignment of 60% of national standards with international norms by 2025, but uneven technology adoption and supply-chain disruptions limit consistency. As a result, most sourcing operations continue to budget for third-party inspections or on-site supervision, adding 5 – 10% to overhead costs.
Minimum Order Quantities (MOQ): China’s mature supply chains support lower MOQs. Stable production and supplier delivery indices in China’s 2025 PMI (Purchasing Managers’ Index) data indicate consistent factory efficiency and fast responsiveness, enabling manufacturers to accept smaller and more specialized orders without significant cost penalties.
Vietnam generally requires higher MOQs to offset lower production efficiency. PMI volatility, such as the 45.6 reading in April 2025, reflects variable factory performance, prompting suppliers to set higher order minimums to cover setup time and ensure profitability. Typical MOQs range from 500 – 1,000 pieces per style or color in textiles and apparel, 100 – 200 units for furniture and home goods, and 5,000 – 10,000 units for smaller items like kitchenware. These thresholds are higher than in more mature markets.
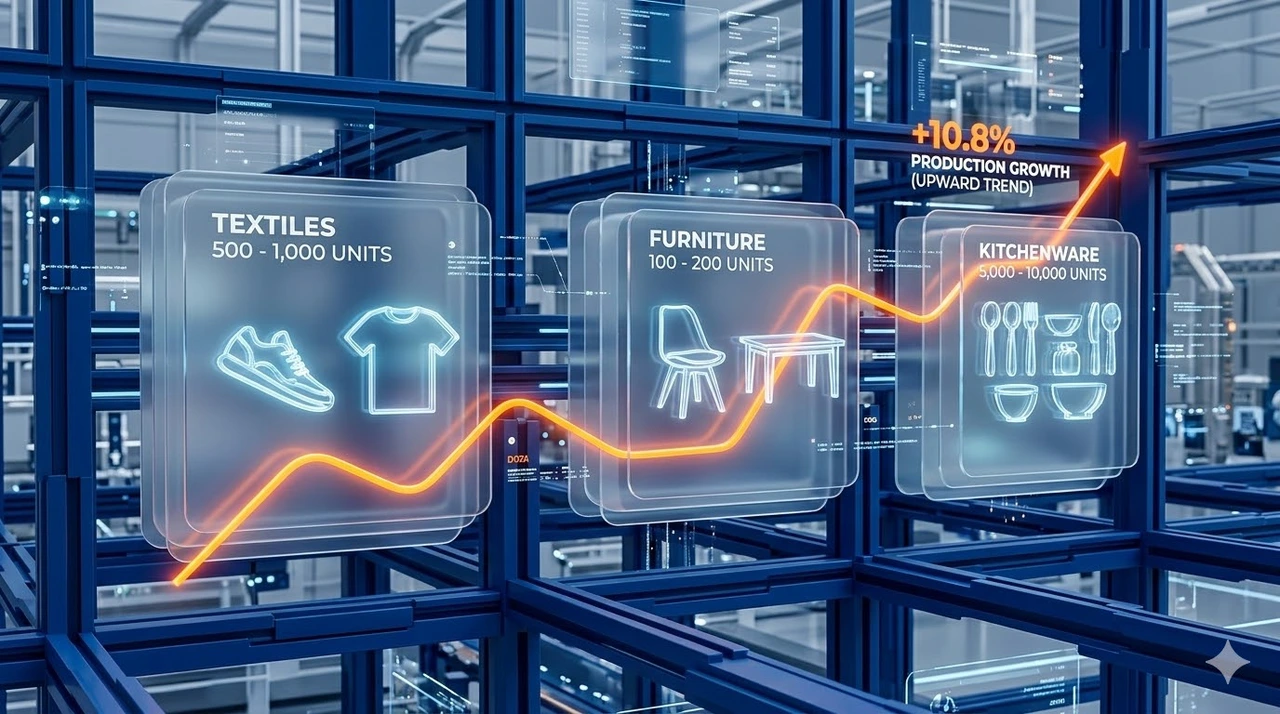
Some flexibility exists for smaller buyers. Certain factories may lower MOQs to 600 – 700 units depending on factory size, material availability, and supplier relationships. Industrial Production Index growth of 10.8% in October 2025 shows capacity expansion for large orders but also reinforces that smaller runs carry a higher MOQ premium.
Tariffs, Duties & Trade Agreements
In the current geopolitical climate, duty engineering is a core component of margin protection. Trade policy is often the catalyst that forces the move from China to Vietnam.
US Import Duties
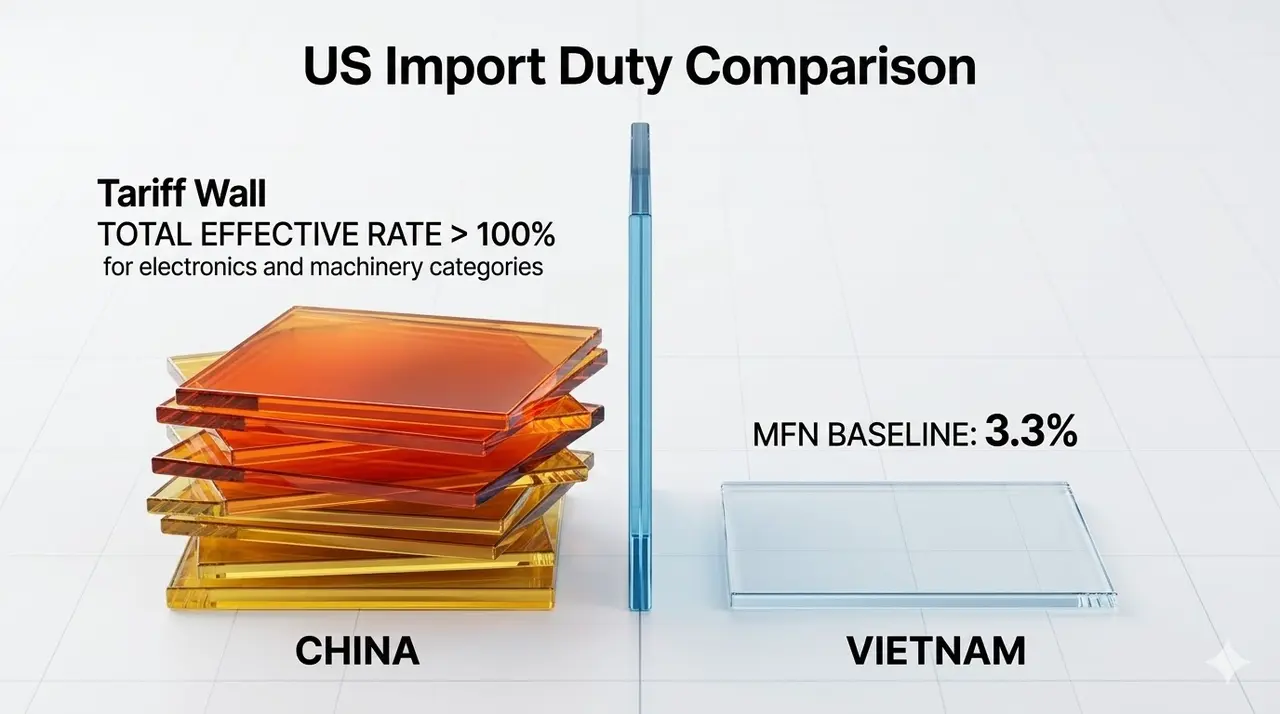
US tariffs remain a major driver of the “China+1” strategy. Chinese goods face elevated duties under Section 301, with List 1-3 tariffs at 25% and List 4A at 7.5%, as documented by the USTR. Additional measures, including Section 232 tariffs on steel and aluminum and case-specific anti-dumping and countervailing duties, can push total effective rates for certain product categories, such as electronics, machinery, and metals, above 100%.
Independent analyses confirm this impact. The Peterson Institute for International Economics reports that the average tariff on Chinese imports rose to 19.3% in 2024, compared to 3.1% before the trade war. These elevated and often stacked duties materially increase landed costs for US importers.
Vietnam faces a far lower tariff burden. Most Vietnamese exports enter the US at the MFN baseline rate of about 3.3% and are not subject to Section 301 tariffs. This creates a significant cost gap – often more than 15–20 percentage points in effective duty exposure – that can offset Vietnam’s higher logistics costs or production inefficiencies. As a result, tariff differentials continue to strengthen Vietnam’s position as a competitive alternative to China for US-bound manufacturing.
Free Trade Agreements (FTAs)
Vietnam benefits from an extensive FTA network that delivers strong tariff advantages. As of 2025, Vietnam has 17 active FTAs, including the EVFTA, CPTPP, and RCEP, providing preferential or duty-free access to major markets such as the EU, Japan, Canada, and Mexico. These agreements support export competitiveness; by mid-November 2025, Vietnam’s total trade turnover exceeded USD 800 billion (according to VITIC), with FTA-driven sectors contributing significantly. Regional integration remains strong, with ASEAN trade reaching USD 45.4 billion in the first half of 2025, or 10.5% of total trade.
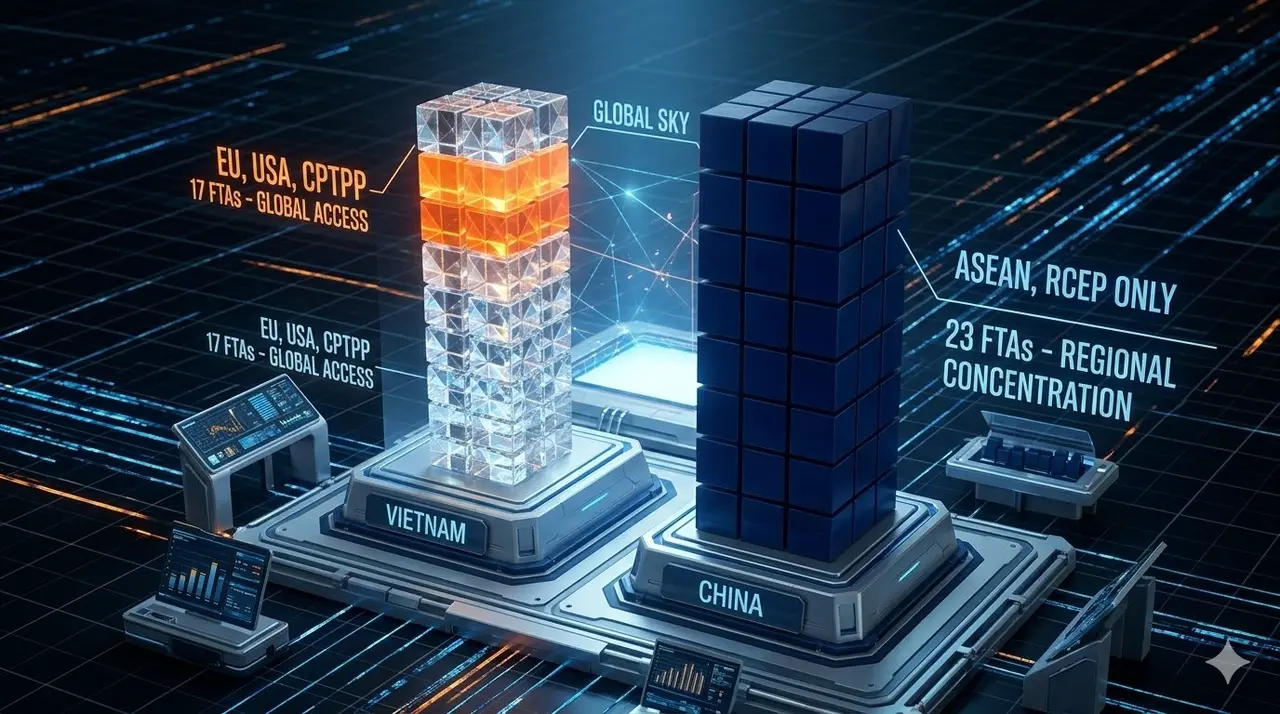
China’s FTA network is more regionally concentrated. China has 23 FTAs covering about 30 countries and regions, including ASEAN (with the CAFTA 3.0 upgrade effective 2025), RCEP partners, and selected bilateral agreements such as the China – Maldives FTA taking effect in January 2025. However, China lacks comprehensive FTAs with major Western economies such as the EU, Canada, and the United States. This limits tariff reductions for Chinese exports compared with Vietnam, which holds broader preferential access in non-US Western markets.
As a result, Vietnam offers superior tariff advantages in key Western destinations, strengthening its position as an alternative sourcing base within the China+1 strategy.
Strategic Recommendations
The choice between China and Vietnam is not binary. The goal is to allocate production to the environment that best supports your product requirements, cost structure, and development speed.
Buyer Profiles
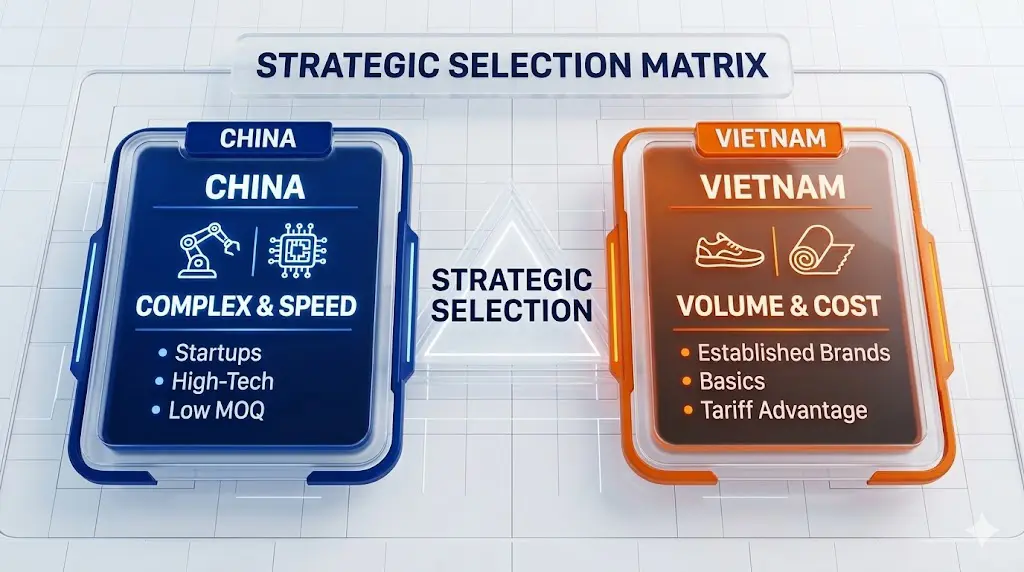
For high-volume, price-sensitive basics: Vietnam provides the lowest landed cost. Labor rates are significantly lower than China’s, and tariff advantages amplify the savings. Vietnamese exports enter the US at MFN rates and benefit from broad FTA coverage, including the EVFTA, which reduces or eliminates duties for EU markets. These advantages hold as long as raw material sourcing and cross-border inputs are managed to limit delays.
For complex, high-tech, or rapid-turnover goods: China remains the stronger choice. Its integrated supply chain, domestic material availability, and automation capacity support fast development cycles and high precision. The “one-stop” ecosystem enables consistent quality, shorter lead times, and reliable scaling for complex product categories.
The ‘China+1’ Strategy
The most effective approach for 2024 – 2025 is to use both China and Vietnam within a single supply chain. Components and technical manufacturing should remain in China, where industrial depth, material availability, and production stability are strongest. Final assembly can then shift to Vietnam to leverage lower labor costs and the tariff advantages created by its FTA network. This structure reduces landed costs while maintaining access to China’s mature component ecosystem.
Startups vs. Established Brands
Startups: China is generally the safer starting point. Lower MOQs, stronger design and engineering support, and the ability to source all components within a single industrial ecosystem reduce friction and speed up product launch. This also serves as a practical caution: small startups should not rush into a “China+1” shift if they lack the resources to manage a more complex, multi-country supply chain.
Established Brands: Larger companies are better positioned to shift production to Vietnam. They have the volume to meet higher MOQs and the resources to manage initial setup challenges. In return, they capture long-term margin gains driven by lower labor costs and favorable tariff treatment in key markets.
Case Study Narratives & Market Evidence
Real-world applications of these strategies highlight the nuance required in execution. The following narratives illustrate the practical friction and success found in shifting supply chains.
Backpack Industry Analysis
The backpack industry illustrates the trade-offs in shifting production to Vietnam. While labor costs are lower, Vietnam lacks a fully developed component ecosystem. Key inputs such as buckles, zippers, and specialized fabrics must still be imported, primarily from China. For buyers that do not operate at scale, the added logistics and coordination costs of moving these materials into Vietnam can offset labor savings and reduce the overall cost advantage.
Corporate Diversification
Major multinationals – including Apple, Samsung, Foxconn, and Nike – have expanded assembly operations into Vietnam, reflecting confidence in the country’s labor capacity and political stability. These shifts, however, focus primarily on final assembly. Core components and technical inputs continue to come from China, where the industrial ecosystem remains deeper and more comprehensive.
A cultural factor also shapes competitiveness. The speed, ambition, and responsiveness often associated with Chinese factory owners – the “China Hustle” – still provide an execution advantage. Vietnam’s industrial culture is progressing, but China maintains a faster operational pace in most manufacturing categories.
Final Thought
The Vietnam-versus-China decision has no one-size-fits-all answer. Each market creates value in different ways, and the right choice depends on your cost structure, operational requirements, and long-term strategy. In 2025, the objective is not to chase the lowest quote but to build a supply chain that is stable, scalable, and aligned with the needs of your product.