Choosing between road, rail, and sea freight from Vietnam is a strategic decision. Each mode affects transit time, landed cost, and risk on key trade lanes to the US, Europe, and Asia. Vietnam’s role as a sourcing hub makes these choices even more important as export volumes and route options expand.
This guide provides a structured view of that decision. It starts with a strategic overview of Vietnam and a comparison of transport modes, then maps core ports and trade corridors, logistics strategy and operations, cost drivers, and compliance. It concludes with visibility, integration, and green logistics, showing how technology and emissions targets are reshaping freight decisions from Vietnam.
Contents
- 1 Strategic Overview: Vietnam as a Global Sourcing Hub
- 2 Comprehensive Analysis of Transportation Methods
- 3 Key Infrastructure and Trade Routes
- 3.1 Vietnam’s Primary Export Gateways
- 3.2 Major Global Trade Corridors from Vietnam
- 3.3 Europe and UK Corridor (From Vietnam to Continental Europe and UK)
- 3.4 Northeast Asia Corridor (From Vietnam to Japan, Korea, China)
- 3.5 Intra-ASEAN and Cross-Border Road/Rail (From Vietnam to China, Cambodia, Laos, ASEAN)
- 4 Logistics Strategy and Operations
- 5 Compliance, Documentation, and Regulations
- 6 Future Directions: Visibility, Integration, and Green Logistics
- 7 Summary: Designing Road, Rail, and Sea Freight from Vietnam
Strategic Overview: Vietnam as a Global Sourcing Hub
Vietnam functions as a primary manufacturing alternative to China for multinational corporations. Major entities like Nike, Samsung, and Hyundai invest significantly in the region. This shift aligns with the “China Plus One” strategy to diversify supply chains and mitigate single-source dependency risks.
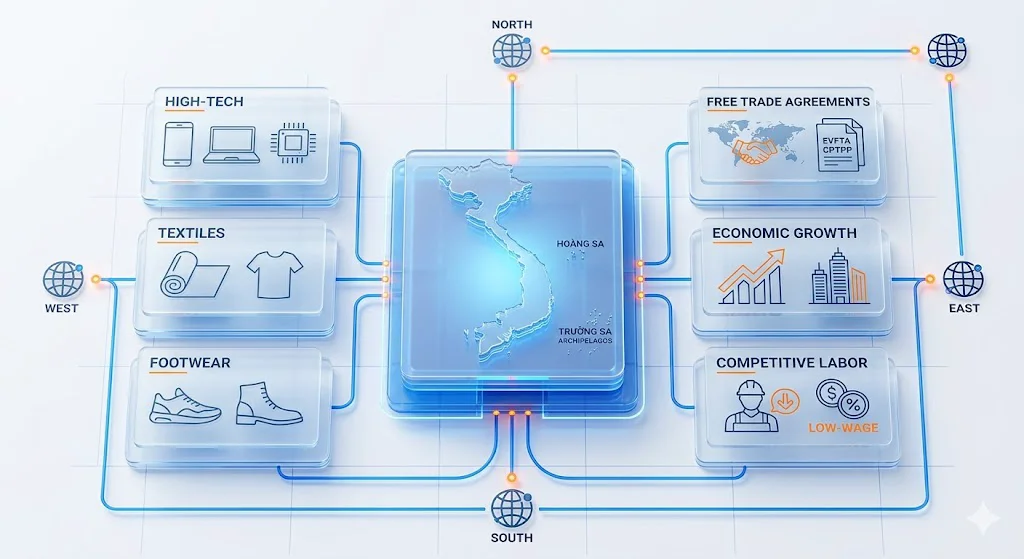
Key economic factors support this growth. The labor market offers competitive costs and a skilled workforce. Stable economic policies and free trade agreements, such as the UK-Vietnam Free Trade Agreement (UKVFTA), provide preferential tariffs. These agreements directly increase profit margins for international buyers.
Vietnam holds a strategic geographical position. Proximity to China facilitates raw material transport, while the coastline provides direct access to international shipping lanes. This location reduces transport costs and transit times within Asia. The export sector now prioritizes high-tech goods. According to the General Statistics Office (GSO), electronic products, and components reached $68.54 billion in 2024, and was Vietnam’s highest-earning export category. Traditional exports remain significant, with textiles at $33.33 billion and footwear at $20.24 billion.
Comprehensive Analysis of Transportation Methods
Companies must balance three factors when selecting a transportation mode: urgency, cost, and cargo volume. Decision-makers analyze the product’s value and perishability against inventory holding costs. Multimodal transport is often the most efficient solution. This strategy combines modes (e.g., rail and truck) within a single container to optimize speed and cost.
Sea Freight (Ocean Transport)
Sea freight handles the majority of global trade. According to the OECD, ocean shipping carries approximately 90% of traded goods by volume. It is the standard choice for high-volume or heavy shipments where cost efficiency takes precedence over speed.
Ocean transport provides the lowest cost per unit. This mode aligns with carbon reduction strategies. Research from the MIT Climate Portal indicates that shipping is the most carbon-efficient transport method. It produces significantly lower emissions per ton-mile compared to air freight. However, ocean transport involves longer lead times. Transit typically ranges from 18 to 35 days for routes between Vietnam and the US or EU. Disruptions such as weather and port congestion cause delays. Consequently, companies must maintain higher safety stock levels to mitigate stockout risks.
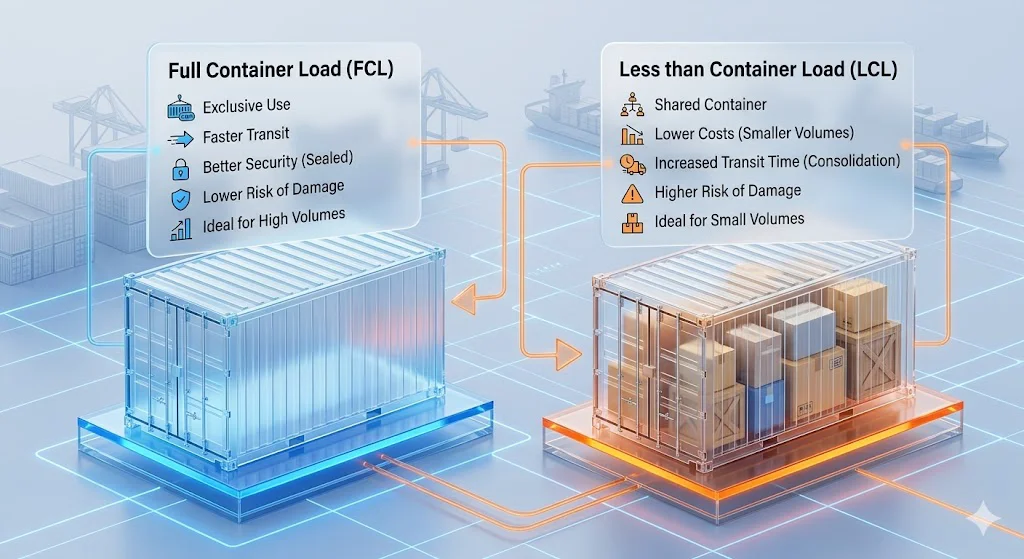
Container Load Options
- Full Container Load (FCL): The shipper uses the entire container (20ft or 40ft). FCL offers faster transit times as it bypasses consolidation. It also provides better security since the container remains sealed from the factory to the destination.
- Less than Container Load (LCL): Goods share space with cargo from other shippers. This option lowers costs for smaller volumes but increases transit time due to consolidation and deconsolidation processes.
Air Freight
Air freight offers the fastest transit times, typically 3 to 7 days door-to-door. This mode is essential for high-value electronics, fashion, or perishable goods. Air transport accounts for only 1% of trade volume but 33% of trade value, according to IATA (International Air Transport Association). It provides high security and global reach, accessing inland destinations without direct sea access.
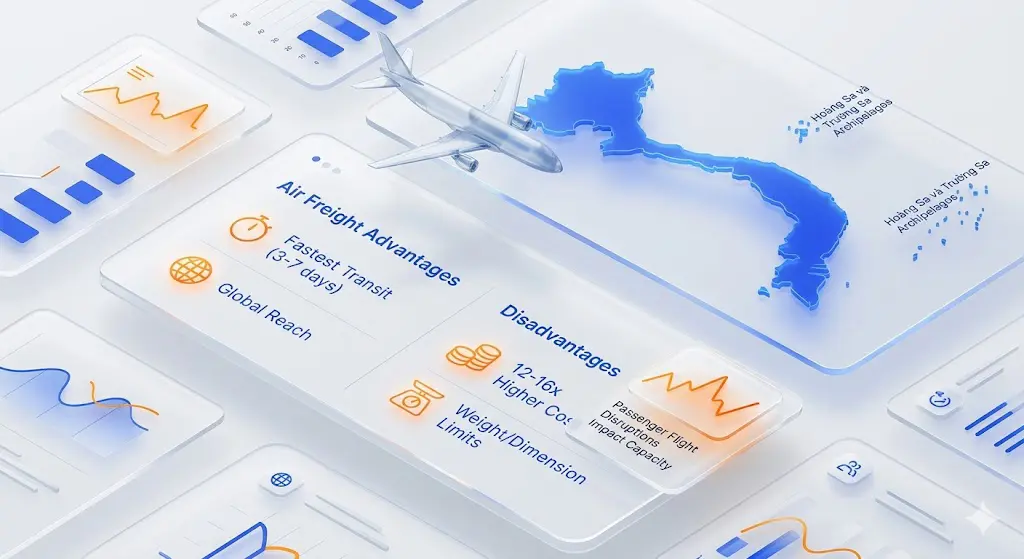
The primary disadvantage is cost. Air freight rates can be 12 to 16 times higher than sea freight. Shipments also face strict weight and dimension limits. Capacity relies heavily on passenger flights, so disruptions in passenger travel directly impact cargo space and pricing.
Road Freight (Trucking)
Road freight dominates domestic distribution and cross-border short-haul transport, such as trade across the Vietnam-China border. Its main advantage is flexibility, as it allows for door-to-door delivery.
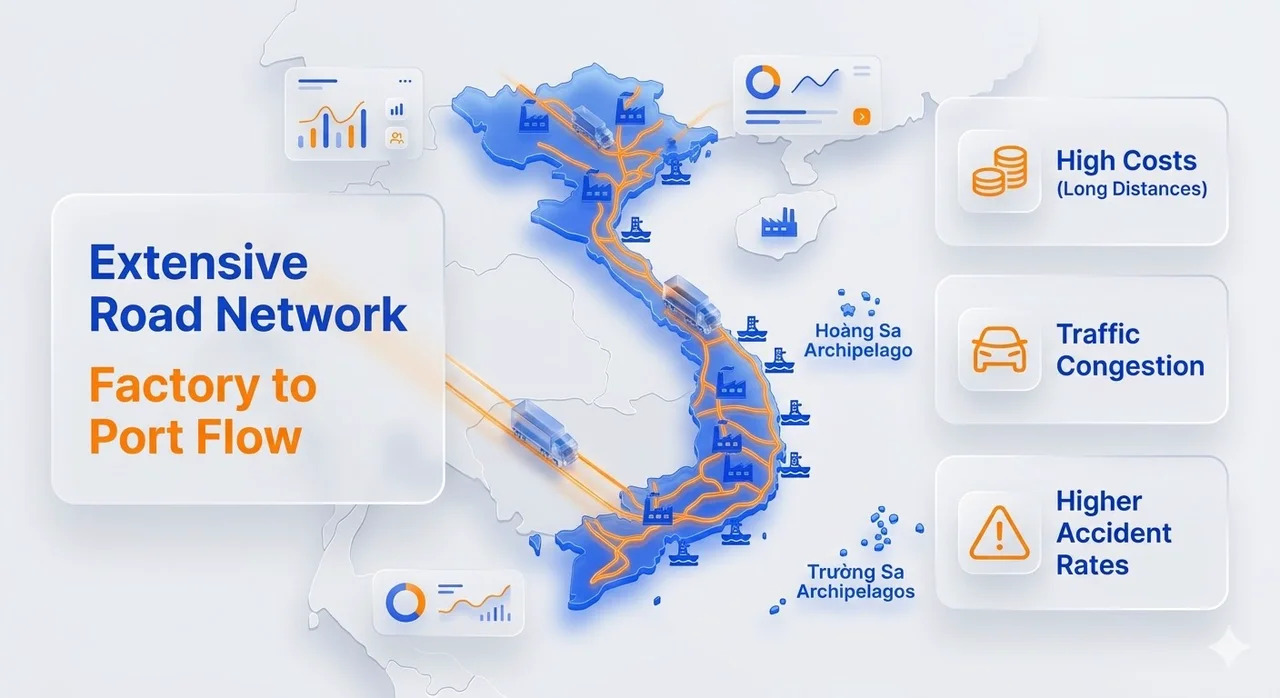
In Vietnam, the road network facilitates the flow of goods from factories to export ports. According to the Ministry of Transport’s Master Plan, the national highway system comprises approximately 25,000 km, including over 150 designated routes. However, road transport incurs high costs for long distances. It also involves operational risks. These include traffic congestion and higher accident rates compared to rail or sea transport.
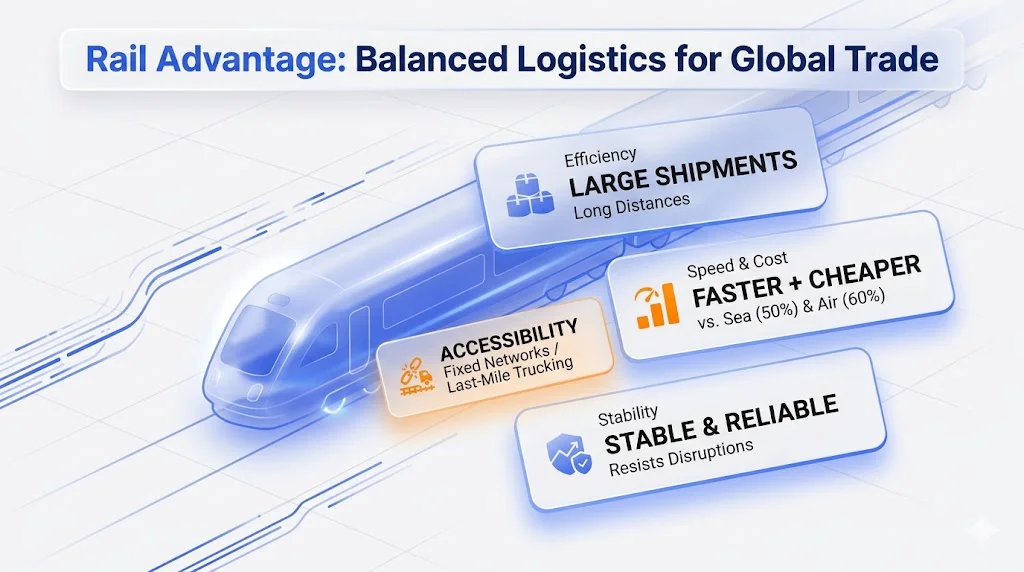
Rail Freight
Rail transport provides a balanced solution for moving large shipments over long distances. The China-Europe Railway Express exemplifies the efficiency of this mode, having operated over 100,000 trains to connect Asian manufacturing hubs with European markets. Logistics benchmarks indicate that rail is generally 50% faster than sea freight and 60% cheaper than air freight. This method offers stability and resists weather disruptions better than road transport. Accessibility remains the main limitation. Rail relies on fixed networks and typically requires trucking for final mile delivery.
Specialized Transport Modes
- Pipeline Transport: This mode specifically transports liquids and gases, such as crude oil and natural gas. It ensures continuous flow and high operational safety. Data from the Liquid Energy Pipeline Association (LEPA) confirms that pipelines remain the safest method for moving energy products, with a safety incident rate significantly lower than rail or truck transport. However, implementation requires substantial initial capital investment for infrastructure construction.
- Intermodal Transportation: Intermodal logistics involves moving goods in a single ISO standard container across multiple modes (Ship to Rail to Truck) without handling the freight itself. A whitepaper by the Intermodal Association of North America (IANA) details how this strategy enhances cargo security and minimizes theft or damage risks. Furthermore, it optimizes total transport costs by leveraging the operational efficiency of each transport leg.
Key Infrastructure and Trade Routes
Port and corridor selection shapes the sea leg and the inland road and rail network at origin and destination. The choice of gateway influences total landed cost, inland logistics cost, and the probability of congestion or customs delay.
Vietnam operates a set of core export gateways. These ports connect directly into the main trade corridors that companies use when exporting from Vietnam.
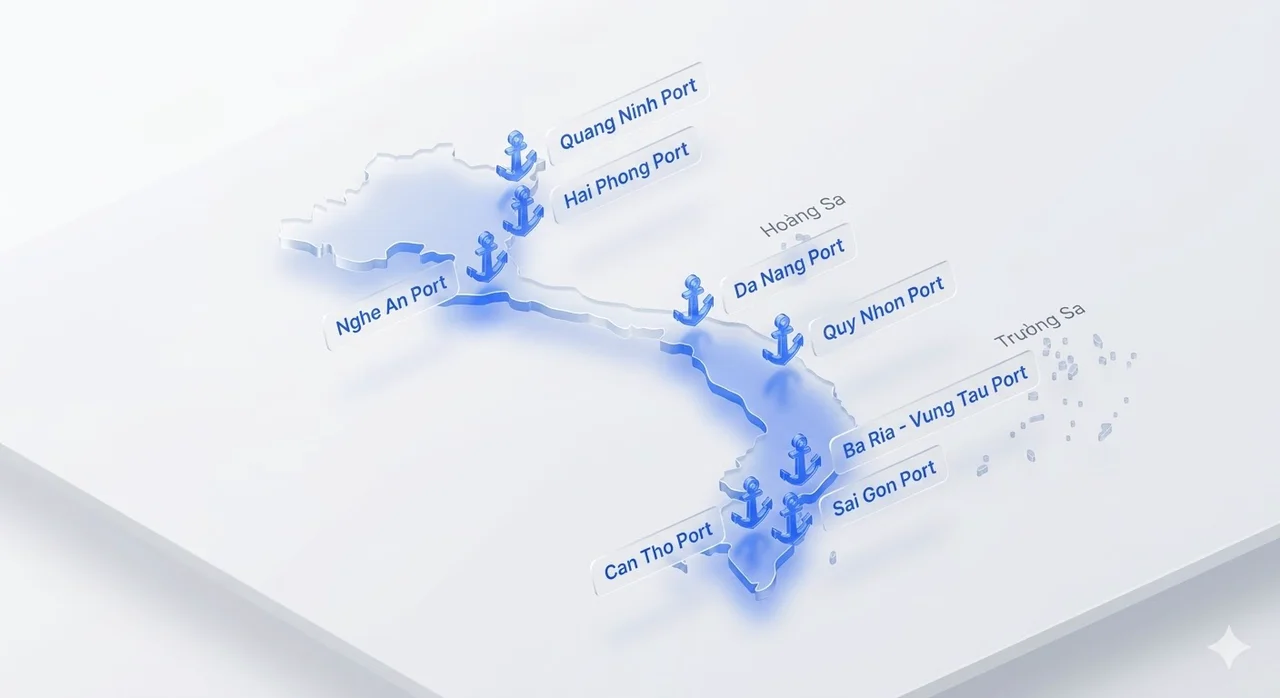
Vietnam’s Primary Export Gateways
Southern Gateway – Ho Chi Minh City (Cat Lai Port)
Cat Lai Port is Vietnam’s largest container terminal. Saigon Newport Corporation reports that Cat Lai handles more than 5.5 million TEUs per year and accounts for a large share of Southern Vietnam’s export volume.
- Insight: High throughput pushes Cat Lai close to capacity in many periods. Truck flows, yard space, and vessel schedules often operate under strain.
- Impact: Companies using Cat Lai need structured truck scheduling, earlier cargo cut-off, and contingency plans for peak periods. For time-sensitive or high-volume flows, routing part of the volume via deep-sea ports, such as Cai Mep-Thi Vai reduces exposure to terminal congestion.
Northern Gateway – Hai Phong / Lach Huyen
Hai Phong is the main maritime hub for Northern Vietnam and the Hanoi industrial region. It sits in the Kunming-Hai Phong corridor and handles significant trade with Southern China. Data from the Hai Phong Portal shows that Hai Phong handles significant cargo volumes connecting to the Kunming-Haiphong corridor. The expansion at Lach Huyen International Gateway now accommodates vessels up to 130,000 DWT, facilitating direct exports to Europe and the Americas.
- Insight: Larger vessel calls and deeper draft reduce dependence on regional feeder hubs and transshipment.
- Impact: Manufacturers in the North can load more volume on direct deep-sea services. Inland legs rely more on short-haul roads and, where available, rail from Hanoi and surrounding provinces, instead of trucking to Southern ports.
Central Gateway – Da Nang Port
Da Nang Port is the primary deep-water gateway for Central Vietnam and is part of one of the country’s three largest seaport systems. It connects central industrial zones and the East-West Economic Corridor to global shipping routes. The 2024 Annual Report of Da Nang Port JSC shows total throughput of around 14-15 million tons and container volume of about 762,000 TEUs, exceeding the plan for the year.
- Insight: Da Nang reduces reliance on Northern and Southern ports for cargo produced in Central Vietnam. The port supports both regional and long-haul services.
- Impact: Companies in Central Vietnam shorten inland road distances and spread export flows across three regions instead of concentrating only on Hai Phong or Southern terminals. This diversification supports more stable lead times and lower inland transport costs per shipment.
Deep-Sea Hub – Vung Tau (Cai Mep-Thi Vai Complex)
The Cai Mep-Thi Vai deep-sea complex serves ultra-large container vessels. Military and industry reports note that the complex has handled vessels such as the OOCL Spain with a capacity above 232,000 DWT. These calls support direct services to the US and EU without transshipment.
- Insight: Direct deep-sea services reduce the number of handovers and intermediate hubs. Ocean transit times to major US and EU gateways decrease compared with feeder-plus-mainline routings.
- Impact: Exporters with stable, high-volume flows can consolidate containers at Cai Mep-Thi Vai, accept slightly longer inland road legs from some provinces, and gain more predictable schedules and lower unit ocean costs on long-haul trades.
Major Global Trade Corridors from Vietnam
Vietnam’s seaports connect into a set of global trade corridors. Each corridor has characteristic port choices and inland road/rail patterns, which should guide how exporters design their freight mix.
Trans-Pacific Corridor (From Vietnam to US & Canada)
For US-bound cargo, the chosen entry coast determines both transit time and the balance between sea and inland road/rail.
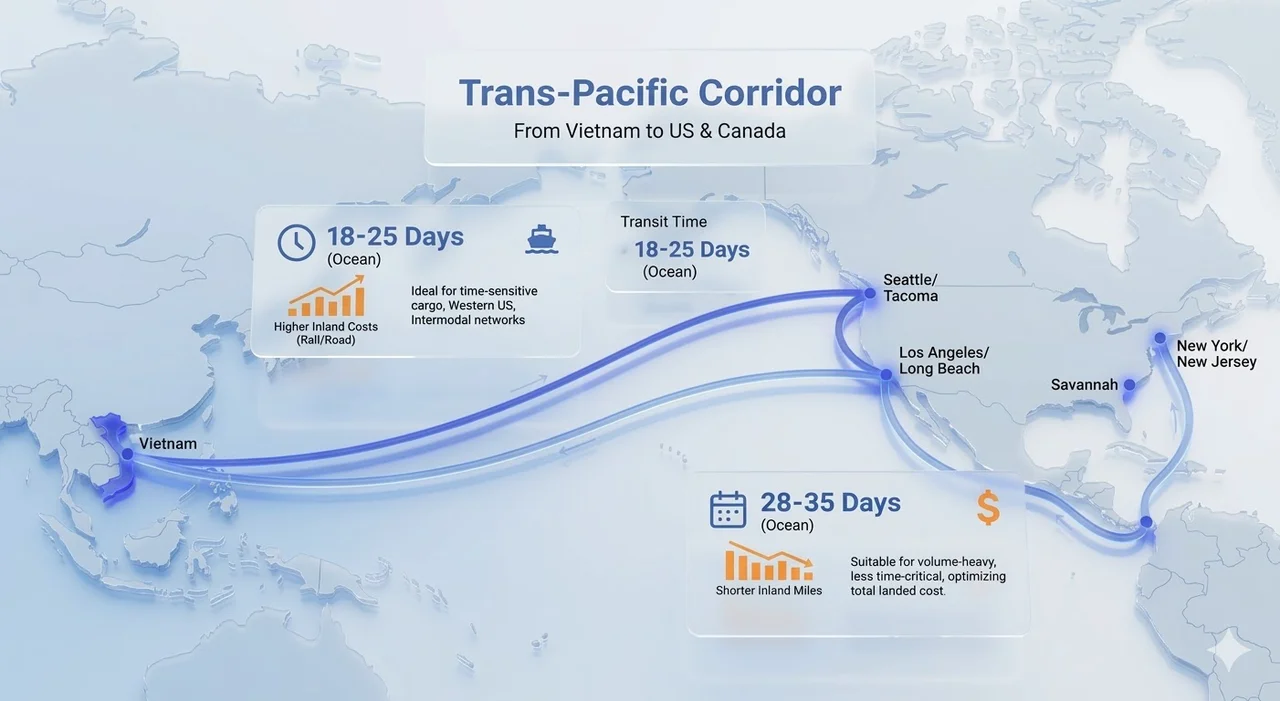
Key US entry options:
- US West Coast (Los Angeles/Long Beach, Seattle/Tacoma): These are the primary gateways for Trans-Pacific cargo. They typically offer the fastest ocean transit times from Vietnam (around 18-25 days).
- Insight: Shorter sea time often comes with longer inland rail or trucking legs when serving the Midwest and East Coast.
- Impact: Ideal for time-sensitive cargo and shipments destined for the Western US or intermodal networks. Exporters must budget for higher inland rail/road costs in exchange for earlier arrival on the West Coast.
- US East Coast (New York/New Jersey, Savannah): Usually accessed via the Panama Canal, these routes have longer ocean transit times (roughly 28 – 35 days) but land closer to major population centers in the Northeast and parts of the Midwest.
- Insight: Longer sea legs can be offset by shorter inland trucking miles into dense consumption and distribution areas.
- Impact: Suitable for less time-critical but volume-heavy cargo where optimizing total landed cost (ocean + inland) matters more than pure transit speed.
Europe and UK Corridor (From Vietnam to Continental Europe and UK)
Most Vietnam-Europe shipments move through North European hub ports, supplemented by specific gateways for the UK.
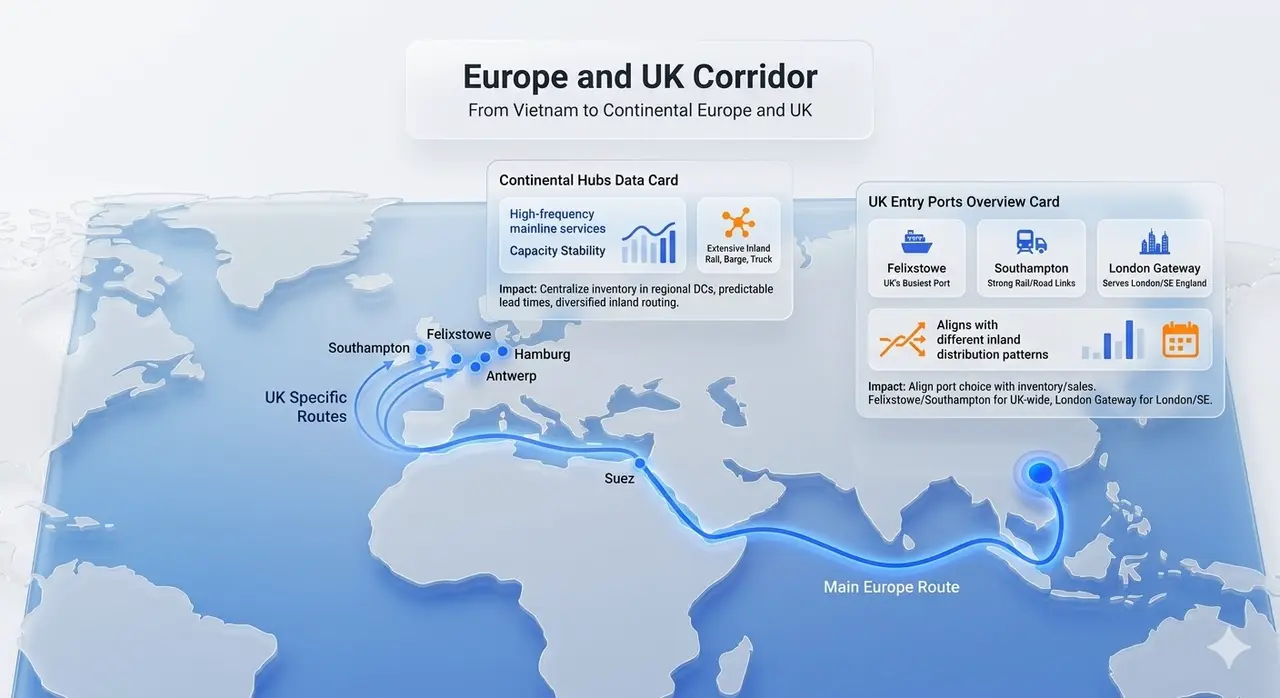
Continental hubs (e.g., Rotterdam, Hamburg, Antwerp): These ports aggregate large Asia-Europe volumes and connect to extensive inland rail, barge, and truck networks.
- Insight: High-frequency mainline services increase schedule options and capacity stability. Inland distribution relies on a mix of rail and road into Germany, France, Benelux, and Central Europe.
- Impact: Companies shipping to multiple European markets can centralize inventory in regional DCs near these hubs and use rail and road for secondary distribution. This structure supports predictable lead times and diversifies inland routing options.
UK entry ports (Felixstowe, Southampton, London Gateway)
- Felixstowe is the UK’s busiest container port, handling about 3 million TEUs per year and acting as a key entry point for high-volume imports.
- Southampton processes container and vehicle flows and offers strong rail and road links to the UK interior.
- London Gateway is a modern deep-sea port designed to serve London and South-East England.
- Insight: Each UK port aligns with different inland distribution patterns. Felixstowe and Southampton connect efficiently to national DC networks, while London Gateway provides short inland legs into the London consumer region.
- Impact: Exporters should align port choice with inventory location and sales footprint. High-volume, UK-wide flows often route via Felixstowe or Southampton. Flows focused on London and the South-East can benefit from shorter inland trucking via London Gateway.
Northeast Asia Corridor (From Vietnam to Japan, Korea, China)
Short-sea services connect Vietnam to major ports in Japan, Korea, and China. These services have shorter transit times than Trans-Pacific or Asia-Europe routes.
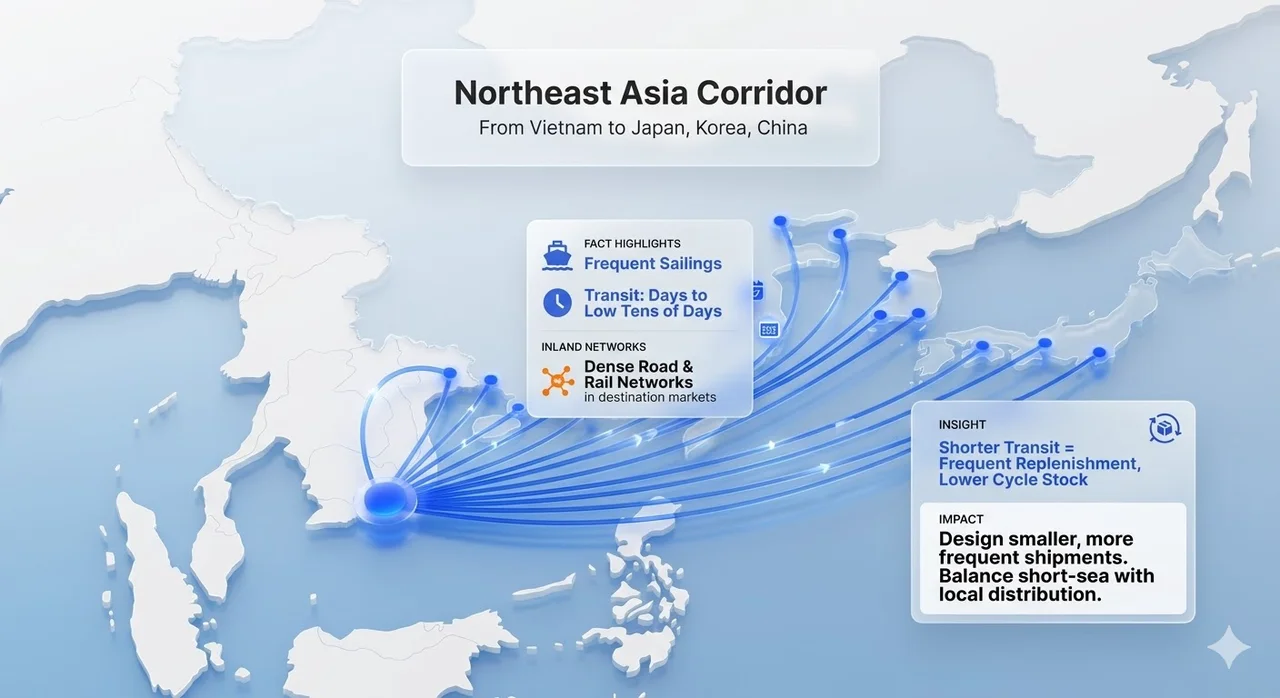
- Fact: Sailings are frequent, and transit times are typically measured from days to low tens of days, depending on port pairs. Inland distribution in destination markets relies on dense road and rail networks.
- Insight: Shorter transit times allow more frequent replenishment and lower cycle stock for brands serving Northeast Asian customers.
- Impact: Companies can design smaller, more frequent shipments and balance short-sea legs with local road and rail distribution, instead of relying on very large batches and long lead times.
Intra-ASEAN and Cross-Border Road/Rail (From Vietnam to China, Cambodia, Laos, ASEAN)
Regional trade within ASEAN and with neighboring countries uses a mix of cross-border roads, emerging rail links, and short-sea services.
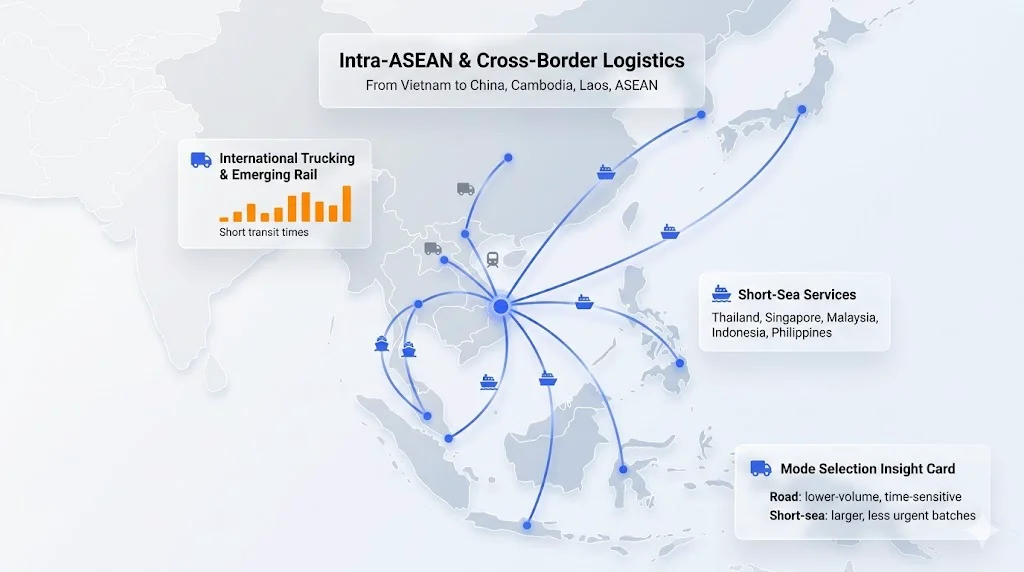
- Fact: Corridors from Vietnam to China, Cambodia, and Laos use international trucking and, in some segments, rail as primary modes. Short-sea services link Vietnam with Thailand, Singapore, Malaysia, Indonesia, and the Philippines.
- Insight: In these corridors, the road is not only a first- or last-mile mode but often the main international leg, especially for lower-volume or time-sensitive flows. Short-sea is used for larger, less urgent batches.
- Impact: Exporters should select mode by corridor. For urgent or smaller shipments, cross-border road or rail reduces lead time. For stable, high-volume flows, short-sea services combined with local road and rail at destination reduce unit cost and support predictable replenishment cycles.
Logistics Strategy and Operations
Supply chain optimization is a continuous trade-off between cost, speed, and reliability. Logistics and supply chain teams need demand forecasts to plan capacity and to respond to external risks such as market volatility and infrastructure bottlenecks. A structured logistics strategy reduces avoidable delays and stabilizes landed costs over time.
Direct Shipping vs. Freight Forwarding
Direct shipping and freight forwarding are two different ways to organize international freight execution. Both can be effective, but they fit different network complexity levels and internal capabilities.
| Dimension | Direct Shipping | Freight Forwarding |
| Operating Model | Shipper contracts and works directly with carriers, and manages bookings, documentation, and coordination end to end. This keeps control and decision-making inside the company. | Forwarder sits between shipper and multiple carriers and manages execution as a single service. This centralizes day-to-day coordination in one external partner. |
| Suitable Complexity | Fits simple, repeatable lanes with a limited number of origins, destinations, and service providers. Network complexity remains manageable for an internal team. | Fits complex networks with multiple origins, destinations, modes, and frequent changes. Forwarder designs and adjusts routings across carriers and corridors. |
| Internal Capability | Requires strong in-house logistics and compliance expertise. Teams must track schedules, documentation rules, and customs requirements on each lane. | Allows a leaner internal team focused on vendor management and performance KPIs. The forwarder maintains operational and regulatory know-how. |
| Service Cost Structure | Fewer third-party service fees, but higher internal workload and fixed headcount cost in the logistics function. Total cost depends on the efficiency of internal processes. | Includes forwarding fees, but reduces time spent on daily operations and issue resolution. Total cost reflects both tariffs and the value of outsourced execution. |
| Risk and Disruption | Shipper handles delays, rollovers, capacity shortages, and regulatory changes directly with each carrier. Response speed depends on internal resources and relationships. | Forwarder manages rollovers, alternative routings, and regulatory changes across its carrier network. Companies leverage the forwarder’s playbooks and scale during disruption |
Decision Framework: Air vs. Ocean
Choosing between air and ocean freight is a cost–service decision. Logistics and supply chain teams need a simple structure to compare both modes on the dimensions that matter most for the business. The table below summarizes the key differences in transit time and cost, schedule flexibility, and sustainability impact.
| Dimension | Direct Shipping | Freight Forwarding |
| Transit time and cost trade-off | Very short transit times and high cost per kilogram. Air is suitable for urgent shipments and products with short life cycles, such as perishables or fast fashion. | Long transit times and low cost per kilogram. Ocean is suitable for less time-sensitive products and for regular, high-volume replenishment. |
| Schedule and flexibility | High departure frequency and more flexible booking options. Air can act as a recovery tool when production or packing is delayed. | Fixed vessel schedules and longer intervals between sailings. Missing a cut-off often adds at least one vessel cycle to lead time. |
| Sustainability and emissions | Higher CO₂ emissions per ton-kilometer. Air usage increases the logistics carbon footprint and can constrain companies with strict emissions targets. | Lower CO₂ emissions per ton-kilometer. Ocean is often the preferred mode for companies that need to reduce emissions while moving large volumes. |
Cost Drivers and Management
International freight cost is not a single number. It is the result of several structural drivers that move over time. Logistics and finance teams need to understand these drivers and reflect them in pricing, budgeting, and contract design. The table below summarizes three core cost drivers and their management implications.
| Cost driver | Description | Management Implication |
| Fuel surcharges (BAF) | Shipping rates are closely linked to global fuel prices. Carriers apply Bunker Adjustment Factors (BAF) to pass fuel cost changes into freight rates. These surcharges move with the market and can change during a contract period. | Companies should track fuel indices used in contracts, model BAF scenarios in margin analysis, and update selling prices or budgets when fuel moves beyond predefined thresholds. Long-term contracts may need clear BAF clauses. |
| Seasonality | Freight demand is cyclical. Periods such as the pre-Lunar New Year rush in Vietnam and the pre-Christmas peak in Western markets drive sharp increases in export volumes. Higher demand leads to rate increases, space constraints, and port congestion. | Shippers should plan earlier cargo readiness for peak seasons, secure capacity through forwarders or carriers in advance, and include seasonal surcharges and delay risks in pricing models and service-level planning. |
| Incoterms | Incoterms define how cost and risk are split between seller and buyer. Under FOB (Free On Board), the seller delivers cargo on board and the buyer controls and pays for the main carriage. Under EXW (Ex Works), the buyer assumes responsibility and cost from the factory gate. | Commercial teams should align Incoterm selection with the company’s logistics capability and pricing strategy. Choosing FOB or EXW changes who negotiates freight rates, who manages customs and insurance, and how transparent each party is on logistics cost and performance. |
Compliance, Documentation, and Regulations
In international trade, shipping documentation and regulatory compliance have legal consequences, not only administrative ones. Authorities use documents and identifiers to assess risk, calculate duties and taxes, and decide whether to release or hold cargo. A structured approach to documentation and key import rules reduces clearance delays, penalties, and unplanned costs.
Essential Shipping Documents
| Document | Core Function | Practical Impact |
| Commercial Invoice | States the transaction value, currency, Incoterms, parties to the sale, and a detailed description of the goods. It is the primary document for customs valuation. | Customs authorities use the invoice as the basis for duty and tax calculation. Incomplete or inconsistent data can trigger revaluation, queries, and clearance delays. |
| Packing List | Lists the contents of each package, including item descriptions, quantities, dimensions, and weights. | Supports physical inspection, cargo reconciliation, and space planning. Accurate packing lists reduce the risk of miscounts, repacking, and inspection-related delays. |
| Bill of Lading (sea) / Air Waybill (air) | Serves as the contract of carriage between shipper and carrier. A Bill of Lading can also act as a document of title in sea freight. | Determines who has the right to claim the cargo at destination and under what terms. Errors in consignee details, notify parties, or release instructions may delay cargo handover. |
| Certificate of Origin | Confirms the country in which the goods were manufactured. Often required under free trade agreements. | Enables importers to claim preferential tariff rates under schemes such as the UKVFTA or other FTAs. Incorrect or missing COO can result in higher duties and post-clearance audits. |
| Shipper’s Letter of Instruction (SLI) | Communicates the exporter’s instructions to the forwarder or carrier, including routing, handling, and document details. | Clarifies responsibilities and minimizes ambiguity between the shipper and the forwarder. A clear SLI reduces the risk of routing errors, wrong declarations, and misaligned Incoterms. |
Import Regulations (US & UK Context)
| Requirement | Juridiction | Description | Practical impact on importers |
| Customs bond | United States | For most commercial imports into the US with a value over USD 2,500, a customs bond is required to guarantee payment of duties and taxes. | Importers must arrange a single-entry or continuous bond before filing entry. Shipments without a valid bond can be held until the bond is in place, affecting lead times. |
| EORI number | United Kingdom | Businesses that import into or export from the UK need an Economic Operators Registration and Identification (EORI) number, typically starting with GB (Great Britain) or XI (Northern Ireland). | Companies must obtain and maintain a valid EORI before customs declarations can be lodged. Missing or incorrect EORI details can block entries and delay release of goods. |
| VAT and customs duties | United Kingdom | Import VAT and customs duties are calculated based on the HS Code, customs value, and origin of the goods. VAT applies to most imported goods, including many low-value consignments. | Importers need correct HS classification and valuation to avoid underpayment or overpayment. Errors may lead to reassessment, additional charges, and potential penalties after audits. |
| Restricted and controlled items | United States & United Kingdom | Certain product categories, such as lithium batteries, hazardous chemicals, pharmaceuticals, and specific food products, fall under additional safety, labeling, or licensing rules. | Importers must verify licensing, labeling, packaging, and testing requirements before shipment. Non-compliance can result in cargo holds, partial destruction, or return to origin, along with administrative penalties. |
Future Directions: Visibility, Integration, and Green Logistics
Logistics operations are moving toward higher visibility, closer integration between planning and execution, and more explicit control of environmental impact. The developments below influence how companies design their freight networks and warehouse setups.
| Theme | Description | Operational Impact |
| Demand Chain Management (DCM) | DCM platforms provide SKU-level visibility from booking through to final delivery and link order data to demand and inventory plans. | Higher visibility supports more accurate inventory planning and allocation. Companies can adjust production, replenishment, and safety stock based on real-time shipment status. |
| Warehouse Management Systems (WMS) | Modern WMS solutions integrate with transport and carrier systems to update stock levels, locations, and asset movements automatically. | Integration reduces manual data entry and gaps between physical and system inventory. This improves picking and packing accuracy and supports more reliable loading and dispatch. |
| Green Logistics and Mode Choice | Many brands are setting emissions-reduction targets and monitoring logistics-related CO₂. Sea and rail generally have lower emissions per ton-kilometer than air and long-haul roads. | Network design increasingly weighs emissions alongside cost and transit time. Where lead times allow, companies shift more volume to sea and rail to reduce the carbon intensity of freight. |
Summary: Designing Road, Rail, and Sea Freight from Vietnam
There is no single optimal freight mode for exports from Vietnam. Road, rail, and sea each add value under different combinations of corridor, volume, service level, and risk. Resilient exporters treat mode choice as a portfolio and adjust the mix as demand, capacity, and trade rules change.
This guide highlights four elements that should sit in the same decision frame: infrastructure and trade corridors, operating models, cost and compliance, and the role of visibility and green logistics. Companies that integrate these factors can align freight with commercial strategy, achieve more stable lead times and landed costs, and shift more volume to lower-emission modes where lead times allow.